Chapter 8
System Monitoring
WorldDesk provides extensive facilities to allow system administrators to monitor and troubleshoot both dial-in and dial-out sessions. This section discusses these capabilities. For detailed information use WorldDesk Manager’s online help facility (see "Using WorldDesk Manager’s Online Help Facility," Chapter 6).
Commuter LEDs
Commuter, a combination hardware/embedded software product, provides a number of LEDs to aid in system monitoring.
Front Panel LEDs
One set of LEDs is visible from the front panel and used to determine Commuter activity and operating status (see Figure 8 - 1 and Table 8 - 1).
Activity LEDs
On the front panel of each Commuter activity LEDs for ports 0 through 11 are labeled "Transmit," "Receive," and "Data Carrier."
Status LEDs
In addition, three LEDs are grouped to the right of the port activity LEDs. These LEDs are "Power," "Ready," and "LAN Attached" and indicate status for Commuter as a unit rather than individual ports.
Frame Type Indicator
During boot up, Commuter automatically detects the frame type in use on the network. Once detected, one of the first four LEDs in the top row will light to indicate the frame type. Frame type LED patterns are as follows:
| If this LED lights | The Frame Type is. . . |
| 0 | Ethernet 802.2 |
| 1 | Ethernet SNAP |
| 2 | Ethernet 802.3 |
| 3 | Ethernet II |
Note: To change the frame type use WorldDesk Manager’s "Server/ Configuration" menu options.
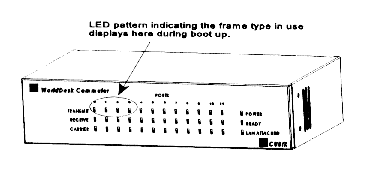
Figure 8-1, Front Panel View - LED Locations
Table 8 - 1, Front Panel LEDs
| LED | Description |
| Transmit | A green LED indicates the corresponding port is sending data. |
| Receive | A green LED indicates the corresponding port is receiving data. |
| Carrier | For WorldDesk Commuter external modem (UART)
products, each port*s carrier LED is illuminated when the port’s incoming RS-232 DCD
signal is on. For WorldDesk Commuter internal modem (PC card modem) products, each port*s carrier LED is illuminated when the PC Card modem is connected to another modem. |
| Power | A green LED indicates WorldDesk Commuter is powered on (AC power is applied). If this LED is not illuminated, refer to Troubleshooting for possible solutions. |
| Ready | A green LED flashes at one second intervals during WorldDesk Commuter operation. If this LED shows no activity when the Power LED is lit, refer to Troubleshooting for possible solutions. |
| LAN Attached | A steady green LED indicates WorldDesk Commuter is connected to a 10BASE-T network and the connection is good. |
Internal LEDs
The internal LEDs located inside the commuter box, are used primarily for hardware troubleshooting, (see Figure 8 - 2 and Table 8 - 2).
Caution
Internal LED's are to be accessed by
authorized persons only.
Do not remove WorldDesk Commuter's lid while power is applied to the unit.
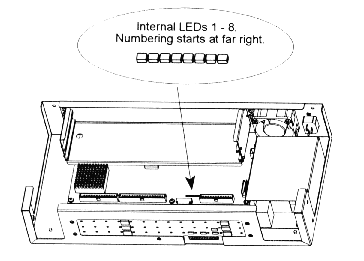
Figure 8-2, Inside View - Internal LED Locations
Table 8 - 2, Internal LEDs
| Purpose | Description |
| Power On Self Test (POST) | Displays test that is in progress. If a system hardware failure is detected, the POST code is useful to Cubix Technical Support personnel in determining the failed component. |
| System Load | The leftmost two lights (as viewed from the front) show boot EPROM read activity and flash memory read/write activity. |
| Network Driver Initialization | The rightmost four lights (as viewed from the front) show the Ethernet frame type that is detected. The lights from right to left represent Ethernet 802.2, Ethernet SNAP, Ethernet 802.3, and Ethernet II, respectively. |
| Normal System Operation | The LEDs show the percentage utilization of available CPU processor time. More lights indicate a busier CPU. |
Monitoring WorldDesk Activity via WorldDesk Manager
All WorldDesk Servers may be monitored via the WorldDesk Manager software. The reader is referred to DOC 833, "Quick Start Guide for WorldDesk Manager," and to Chapter 6, "WorldDesk Manager," in this document for instructions on installation and basic operation of this software.
Effective systems management requires the ability to monitor each of the major functions of the WorldDesk Server. This section is organized topically such that an administrator may, following this guide, discover which WorldDesk Manager menus and screens may be used to analyze each functional area.
Discovering Clusters, Servers, and Ports
WorldDesk Manager continually monitors the internetwork on which it is operating to locate WorldDesk Clusters, Servers, and Ports. An icon is always displayed for each cluster that is found. Clusters may be expanded to display servers, and servers may be expanded to display attached ports. The left mouse button is used to expand or contract the display for these objects (see Figure 8 - 3).
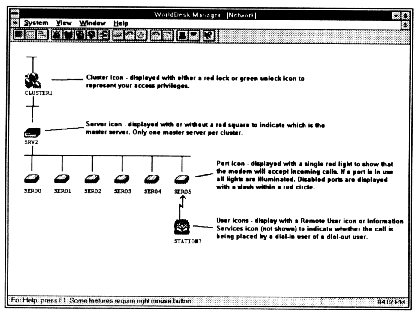
Figure 8-3, Cluster, Server, Port, and User Icons
Cluster Icon
Cluster icons are displayed with a green unlock or red lock symbol which indicate the access privileges associated with your WorldDesk Manager username/password combination.
A red lock symbol indicates that your WorldDesk Manager username/password combination was configured with read access privileges. This privilege enables you to monitor (view) any data associated with the granting server.
A green unlock symbol means you have set access privileges which enables you to both monitor data and change settings on the granting server. See "WorldDesk Manager and Management Security" in Chapter 6, and Chapter 7, "Security Concepts and Planning" for details.
Server Icon
One server icon in each cluster may be displayed with a red square adjacent to it. This symbol indicates that the server has been designated as the master server for the cluster in which it is operating, (see "The WorldDesk Cluster Master" in Chapter 2 for details).
Port Icon
Ports are displayed as a modem icon. In the modem icon, a single red light is shown if the modem will accept incoming remote node dial-in calls. If the port is allocated or in use, all of the red lights in the modem icon are illuminated. If dial-in is disabled for a specific port, that port will appear with no lights illuminated when the port is idle. Ports that are disabled are displayed with a red circle with a slash.
WorldDesk Manager will only discover WorldDesk Servers that are set for the same Ethernet frame type as is being used by the WorldDesk Manager. WorldDesk Manager successfully displays servers located on other (possibly remote) WAN network segments.
Monitoring Server Usage
The first indicator of WorldDesk Server health may be found in the server statistics screen (Figure 8 - 4). To access this screen right click on the server icon then select the Statistics/Server menu options.
Particularly high CPU utilization may indicate a need to reduce the demand placed on the server by separating the activity to more than one server. This screen may also be used to display the version of software under which the server is operating.
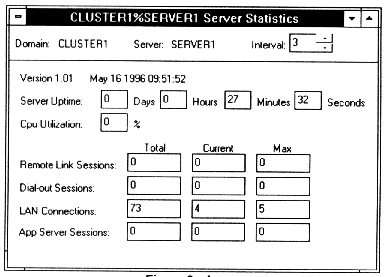
Figure 8-4, Server Statistics Screen
Monitoring Port Usage
The ability to monitor port usage enables you to troubleshoot a variety of problems including the inability to establish connections, unexpected disconnection and performance problems. Two WorldDesk Manager screens provide port information: the server menu*s Port Summary screen and the port menu*s Port Statistics screen.
The Port Summary window (see Figure 8 - 5) displays one line for each active port on the WorldDesk server. For each port, the current port state, allocating user, and current RS-232 signals are displayed. Most port state names are self-explanatory. Ports that are idle are in either state "Waiting" or "Dial-out Waiting". Ports in the latter state are not available for remote node dial-in use. The name of the user is displayed for active ports. Access the Port Summary screen by right clicking on the server icon and selecting the Statistics/Port Summary menu options.
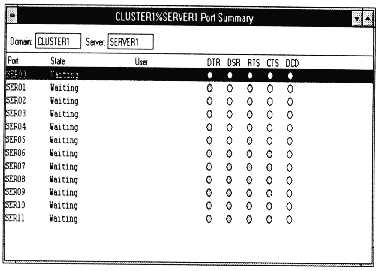
Figure 8-5, Port Summary Screen
The Port Statistics screen (see Figure 8 - 6) may be reached by right clicking on the port icon then selecting the Statistics/Port options. When the Port Summary screen appears, double click on the port for which you want data displayed. The Port Statistics screen shows more detailed information one port at a time. In addition to showing the allocating user, the time at which the port was allocated and the type of allocation (LAN for dial-out or remote for remote node dial-in) are provided.
Additionally, the direction of the call (inbound or outbound), the modem*s connection information, and the call start time are displayed. Note that the call start time and the port allocation time may be different; the port may be allocated and subsequently be used to place multiple calls. The phone number of the remote system is displayed when it is known.
Finally, the Port Statistics screen displays the reason for the last disconnection of the port. A disconnection is said to occur when the port is released for dial-out use by another user or to accept another dial-in call. The last disconnect reason is most often useful to help desks in troubleshooting lost connection problems.
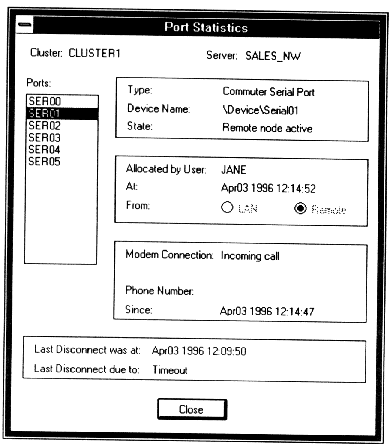
Figure 8-6, Ports Statistics Screen
Monitoring Network Connections
The WorldDesk Server may accept network connections via IPX/SPX or TCP/IP from various clients (see Figure 8 - 7). Such clients include WorldDesk Manager and dial-out clients. For each connection, the client username and the name of the application that is using the connection are displayed. When a port is allocated (for example, during a dial-out session), the name of that port is displayed. Packet transmit and receive activity may be used to determine if a connection is "alive". WorldDesk servers automatically monitor all connections to detect failed clients. To view network connections, right click on the server icon and select the Connection menu option.
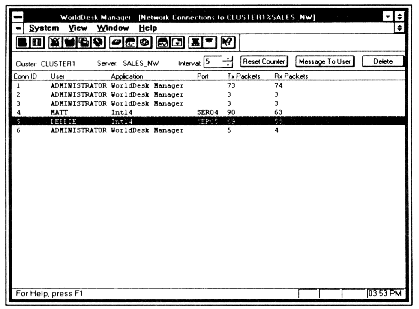
Figure 8-7, Network Connections
Detailed connection information for each connection may be viewed by double clicking a connection line in the Network Connections display (see Figure 8 - 8). Information available includes the client and server network addresses, the connection start time, further detail on the usage of the port by the associated application, security permissions granted to the client, and packet queue information.
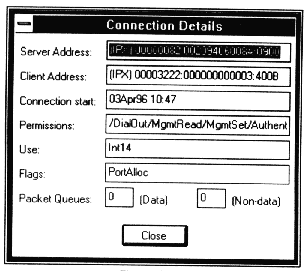
Figure 8-8, Connection Details Screen
Monitoring Dial-in Sessions
Several screens are provided to assist in monitoring remote node dial-in sessions. The cluster menu*s address list screen and the port menu*s remote link statistics screens provided the primary dial-in user information.
The cluster menu*s address list (see Figure 8 - 9), displays the MAC address and username of each remote node client that is known to any server in the cluster.
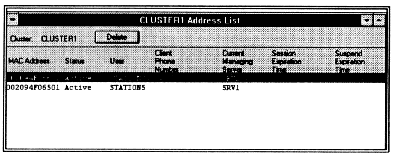
Figure 8-9, Address List Screen
The status displayed indicates whether the client is physically connected (Active) or logically connected (Suspended) at the current time. The remote client phone number is displayed if known. Session and suspend expiration times represent the time at which the server will terminate the session due to security session limits and suspended session limits configured by the administrator. See Chapter 7, "Security Concepts and Planning" for details. To view the address list, right click on the cluster icon and select the address list menu option.
The Remote Link statistics screen (Figure 8 - 10), provides information about dial-in clients using the serial link. Packets are classified by MAC frame type, protocol type, and miscellaneous information derived from the server’s analysis of the packets. Throughput on the link displays graphically via the Stats/Graph toggle button. Remote Link statistics reset after every connection, so the displayed data is accurate for the currently connected dial-in user.
To view remote link statistics, right click on the port icon and select the Statistics/Remote Link options.
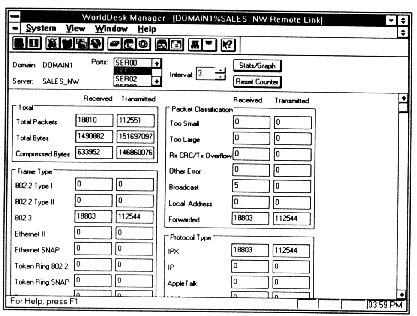
Figure 8-10, Remote Link Statistics Screen
Monitoring Dial-out Sessions
Dial-out sessions may be monitored by tracking the network connections used by the client to connect to the WorldDesk Server and by monitoring port statistics for the ports allocated by that user. For information on monitoring network connections, see "Monitoring Network Connections." For information on monitoring port statistics, see "Monitoring Port Usage."
Monitoring Network Traffic
A view of current network traffic may help administrators to understand performance problems related to very busy networks. Some WorldDesk Servers have an embedded hardware packet handler that avoids heavy CPU utilization associated with busy networks.
The server*s network statistics screen (see Figure 8 - 11), provides statistical and graphical representations of current network traffic. Both packets filtered (that is, those packets examined by the WorldDesk Server software) and packets forwarded (that is, packets examined and routed to or from a remote node client) are displayed. Packets included in the Local Destination field are packets destined for the WorldDesk Server software. Servers with high discarded packet rates may benefit most from the WorldDesk embedded hardware packet handler. To access the server’s network statistics, right click on the server icon and select the statistics/network options.
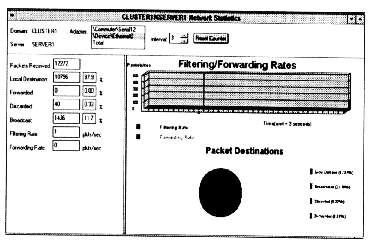
Figure 8-11, Server's Network Statistics Screen
Monitoring Remote Users
WorldDesk provides the ability to monitor drivers in use at remote client workstations via the established dial up link. "Management of Remote Nodes" in Chapter 3 provides information on how to use WorldDesk Manager to monitor remote users.
Perhaps the most important data from the remote user statistics information is the Serial Driver*s count of UART FIFO overflows. A FIFO is a buffer in the UART chip that holds data as it is received from the communications link. Some UARTs (such as the 16C55x UART) have a sixteen character FIFO, while older UARTs (such as the 8250 or 16C45x) UART have one character FIFOs. When a FIFO overflow occurs (that is, the software fails to read the data from the FIFO before the next character arrives on the serial link), data is lost.
FIFO overflows are particularly harmful for remote node users because the entire packet in which a character is lost must be discarded and resent. This can often require retransmission of as much as 1500 characters. FIFO overflows greatly degrade performance on a remote link. If FIFO overflows occur frequently, reduce the remote client*s configured baud rate to improve performance.
Monitoring Significant Events in a Cluster
WorldDesk Manager provides a console on which significant events can be reported by servers. The console for a cluster collects and consolidates information from all servers in the cluster. Some important messages can be configured to require an operator acknowledgment, while less important messages may scroll off the console or be ignored entirely. To view these events, right click on the cluster icon and select the Console menu option: the Cluster Console screen appears (see Figure 8 - 12).
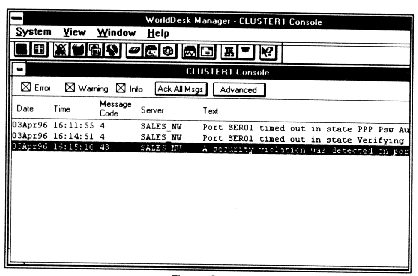
Figure 8-12, Cluster Console Screen
To display additional information for a specific message, highlight the message and double click to display the Message Detail screen (Figure 8 - 13).
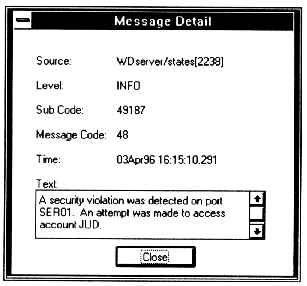
Figure 8-13, Message Detail Screen
Monitoring Comlink Under Windows NT
Comlink operates as a Service under Windows NT. Like other Windows NT Services, Comlink may be started and stopped through the Control Panel*s Services icon. The WorldDesk Server makes use of various NT device drivers. These device drivers may be started and stopped through the Control Panel*s Devices icon. Under normal conditions, Comlink’s operation is fully automatic; no operator intervention via the Control Panel is necessary.
Performance of the Windows NT system on which Comlink executes may be monitored via the Windows NT Performance Monitor utility. Consult the documentation provided with Windows NT for instructions on the use of this tool.
This document, and all Web contents, Copyright © 1997 by Cubix Corp., Carson City, NV, USA.